Forestry & Land Resource
Consultants, Inc.
Consultants, Inc.
Land Classification Projects
The purpose of land classification is to make money. It does this by helping
land managers, money managers, and researchers make better decisions.
land managers, money managers, and researchers make better decisions.
A land classification project can be broken up into several stages. Reconnaissance
and pre-mapping occur before field mapping begins. The routine, day to day, beating
the bush field work can be subdivided into map making and data collection. After
field work is completed cartographic finishing of the maps prepare them for entry into
a GIS system. The data that is collected in the field is turned into information
through data summary and evaluation of land qualities. Site specific management is
the pay off. Analysis or interpretation of the maps and supporting information help
managers to take better decisions.
Site specific management - The purpose of land classification is to make money. It
does this by helping land managers, money managers, and researchers make better
decisions. Experienced land managers learn from mentors or trial and error what
practices work well on specific sites. By projecting the land qualities of a site with
known successful experience to the entire survey area the experience of one land
manager is captured and transferred to other pieces of land and other land
managers. Results from research can be matched to those areas where it applies.
Areas that fall under regulatory jurisdiction can be identified and managed
accordingly. Strategic decisions are enhanced with a sure inventory of the land base.
Planning
Reconnaissance - Strategic planning at the beginning of a project saves time and
improves quality by learning what is already known. Area specific surficial geology
reports, ground water reports, topographic maps, vegetation guides, stand maps and
history, ownership maps and other published reports are reviewed. Digital aerial
images are obtained, prepared, and organized. Past and present management
practices on the land base are examined.
Pre - mapping - Tactical planning before mapping an area includes stereoscoping
photos and drafting obvious boundaries. Traverses and hole locations are planned.
Special features like research plots or unusual photo tones are noted so that they can
be investigated while mapping.
Mapping
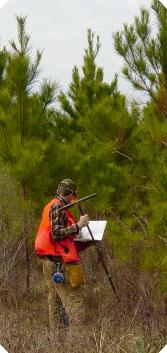
Map making - Soil mapping is the art of illustrating nature by
pushing lines across aerial images following observable
geomorphology or vegetation/photo tone indicators which are the
natural guides for distinguishing different kinds of land.
Specifications vary from customer to customer. Recorded
observation densities range from 1 per 10 acres to 1 per 22
acres. Soils are observed to a minimum depth of 4 feet.
Contrasting inclusions range in size from 1/4 to 2 acres. Similar
inclusions range in size from 10 to 30 acres. Either modified grid
or free survey techniques are used for locating observation points.
Legends are either controlled or code. Color IR doqq's are
preferable but true color or B&W photos are sometimes
geo-referenced and used. Digital rasters of topographic maps or
hypso layers are used for topographic reference. Soil poly line
segments are captured in the field using ArcPad and then
incorporated into polygons using ArcView.
Data collection - At each observation point data is entered into a data recorder.
Specific nature of data collected varies from customer to customer. Examples are soil
type, drainage class, landscape position, geologic formation, soil horizons (depth,
name, texture, special features), common understory vegetation, pH, stand age and
heights, slope, stand history, coarse fragments, inherent fertility, and any other
observable or measurable feature that may impact intensive forest management. Soil
samples are collected for some customers and the results of lab analysis form a
portion of the soil inventory data base. From the data collected and features studied,
the mapping can be referred to as site mapping and not just soil mapping.
Cartography, GIS, and Data Analysis
Cartographic finishing - Maps are proofed and polished as the field work is completed.
New maps must join and match existing maps. Errors and omissions are corrected.
Soils are "heads up" digitized as polygon features for a tract or compartment. The
features are then appended to previous mapping usually to a polygon feature class in
a geodatabase.
GIS - Typically, land classification produces two layers in the GIS system. One layer is
the soil map unit polygons which spatially display the different kinds of land. The
second is a layer of uniquely numbered points that link the data collected to its
collection location. Query systems using decision keys based on Boolean logic or
lookup tables associate management recommendations with different kinds of land.
These files are usually delivered as feature classes in a geodatabase.
Data summary and land qualities - Data is summarized by map unit. Summaries
include range and distribution of surface and subsurface thickness and texture. Range
and distribution of depth to and nature of various soil horizons are quantified. Range
and distribution of drainage class and landscape positions are summarized. Site index
measurements are evaluated. Vegetation type summaries are created. Data
summaries are analyzed to develop land qualities. Examples of land qualities include
droughtiness, wetness, flooding potential, site quality, inherent fertility, workability,
erodability, trafficability, hardwood regrowth potential, physical degradation potential,
nutrient retention, and rooting conditions.